
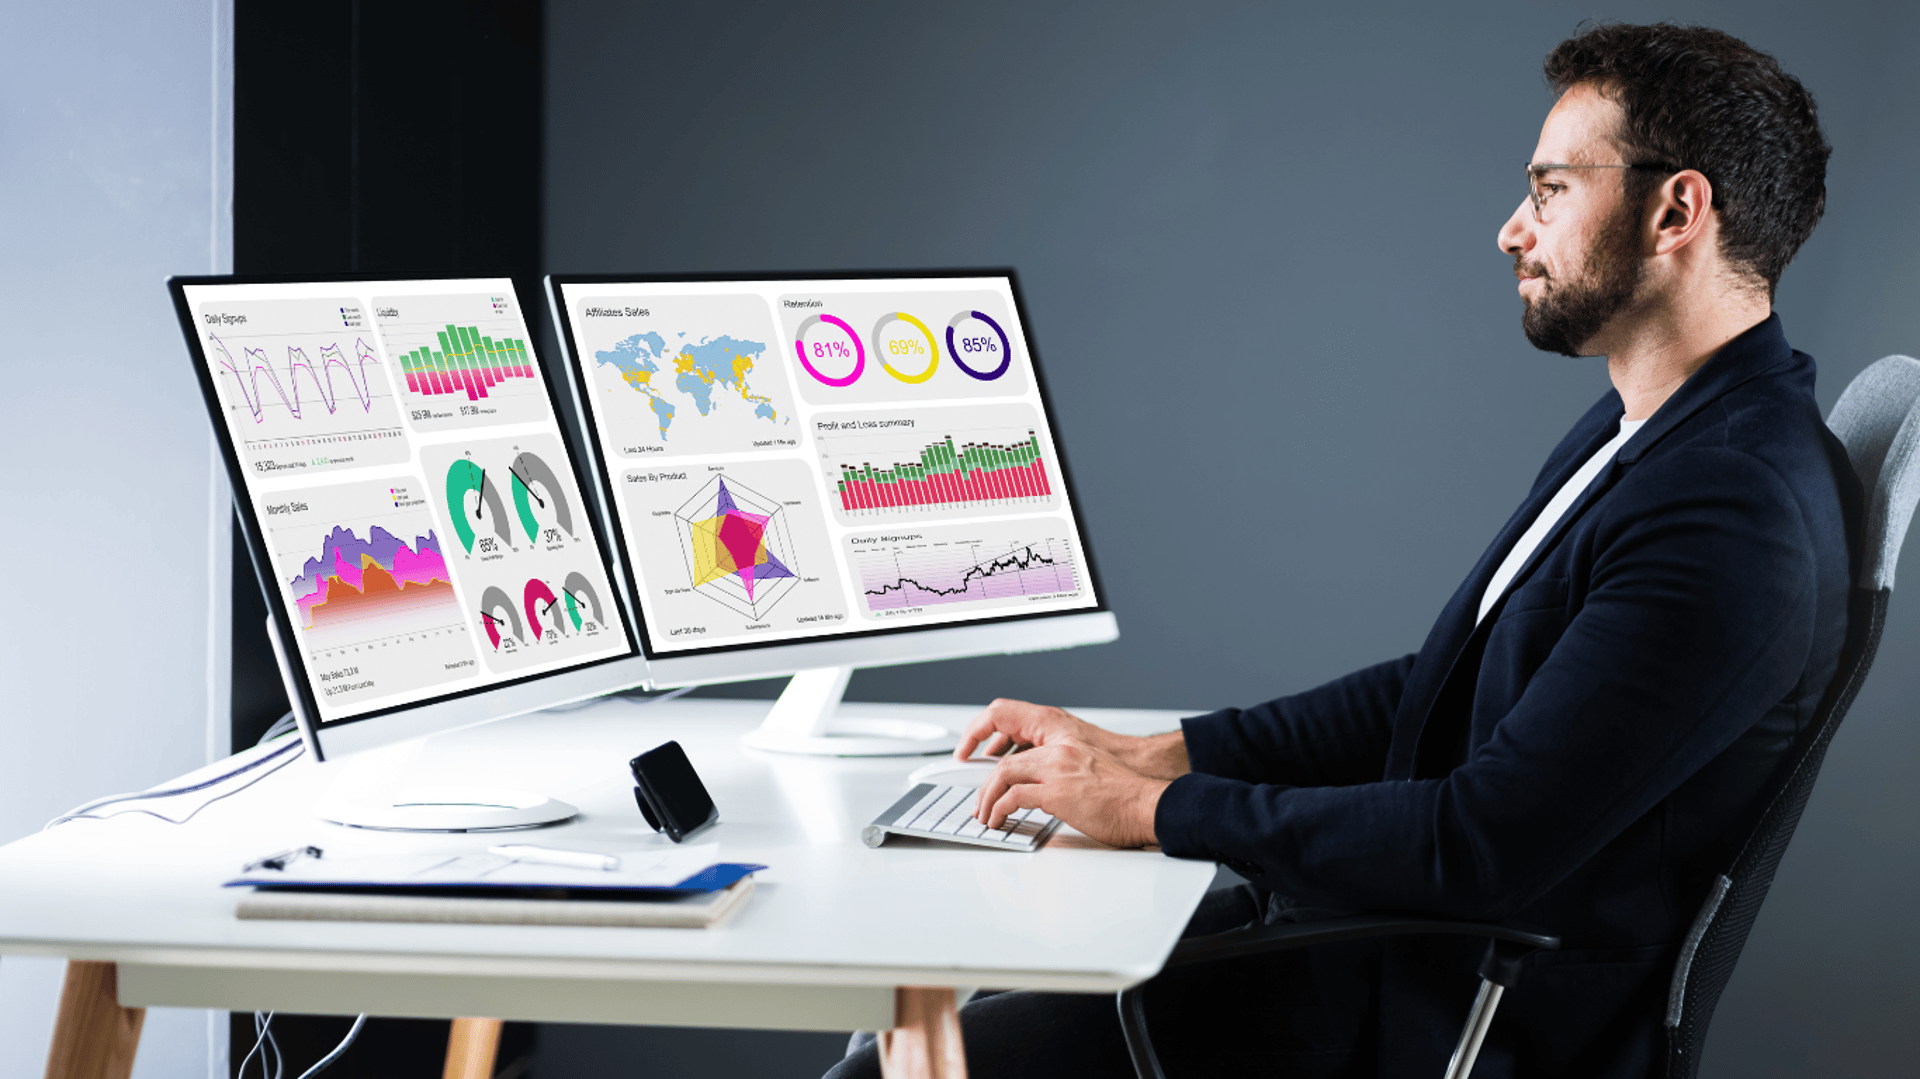
Large information panel according to client's requirements
CONSOLIDATED INFORMATION ABOUT ALL KEY INDICATORS OF THE COMPANY, DEPARTMENT, SUBDIVISION, PRIVATE ENTREPRENEUR, ETC. ON THE SCREEN OF YOUR PHONE, TABLET OR COMPUTER.
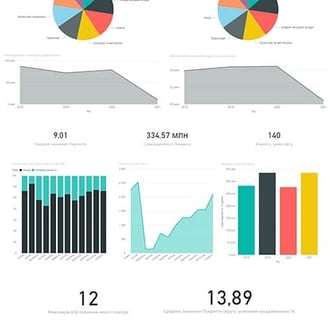
An information panel (dashboard) is a modern format for the collection and visual presentation of large data sets (in the form of graphs, charts, maps, etc.). This is an analytical panel with a clear look for interactive interaction with a huge number of constantly changing indicators.
The information panel will provide you with smart reports in real time, thanks to which you will see what is happening right now in the company, its divisions, a specific employee, etc. This allows you to avoid unnecessary delays and make a decision ten times faster.
Key features of the dashboard
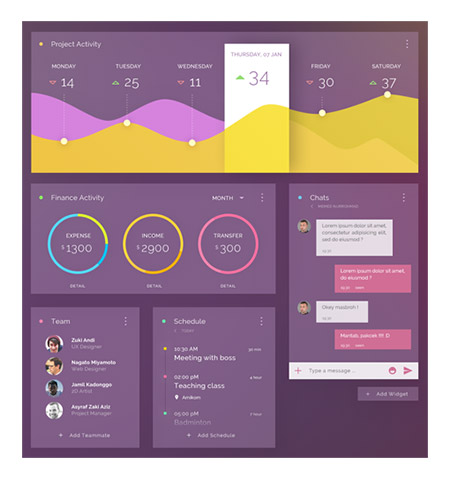
Displaying the necessary indicators in a single window without the need to move from one interface to another. Everything of interest to dashboard users can be placed in one field without having to switch slides and change graphics.
Interactivity. Ability to adjust visualization and indicators according to user tasks. For example, to show data about people's health for a selected period of time or information about the sale of a product in a specific territory
The ability to compare and compare data during the initial data analysis.
Identification of problems that could be overlooked by management.
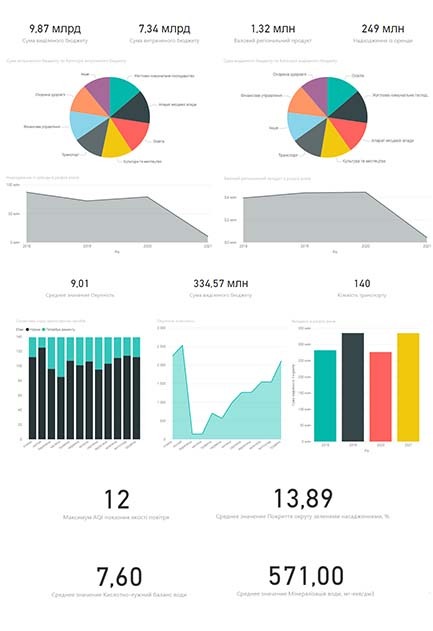
Dashboard indicators
the ability to filter according to the names of tasks, groups, projects, responsible persons or terms for a convenient display of exactly those tasks that are interesting at the moment;
filtering settings according to various criteria (employee, period, department, etc.);
convenient graphical structural display in the form of network diagrams to display connections between various contact persons (partners, customers, etc.);
possibility of grouping by different criteria;
displaying contact information such as phone numbers, e-mail addresses, etc.;

summary information about the company's current and completed projects in one place;
project budgets;
dates of start, planned completion, and actual completion of projects;
visual indication with the help of color about the status of the project in relation to the deadlines (not overdue / overdue and for how long);
grouping of tasks by projects, working groups, etc.;
visual color coding by tasks responsible for performance;
color coding according to various signs, such as the presence of a signed contract, etc.;
displaying information about employees' working hours from working time accounting systems and task setting systems in real time;
the ability to see information on the planned working time and its actual use;
the possibility of grouping by different periods (day, month, quarter, etc.).

A dashboard is a tool that simplifies obtaining and analyzing key information about your activities. With its help, you can quickly understand trends, identify problems, and make informed decisions for successful management.