
Information panel for a city council deputy
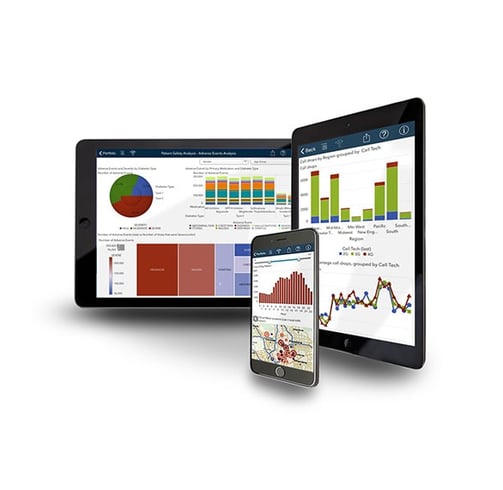
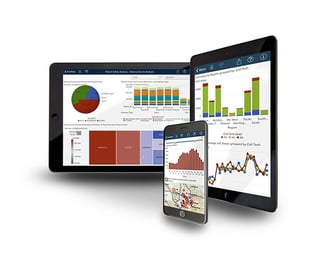
CONSOLIDATED INFORMATION ABOUT YOUR ELECTION DISTRICT ON THE SCREEN OF YOUR PHONE, TABLET OR COMPUTER
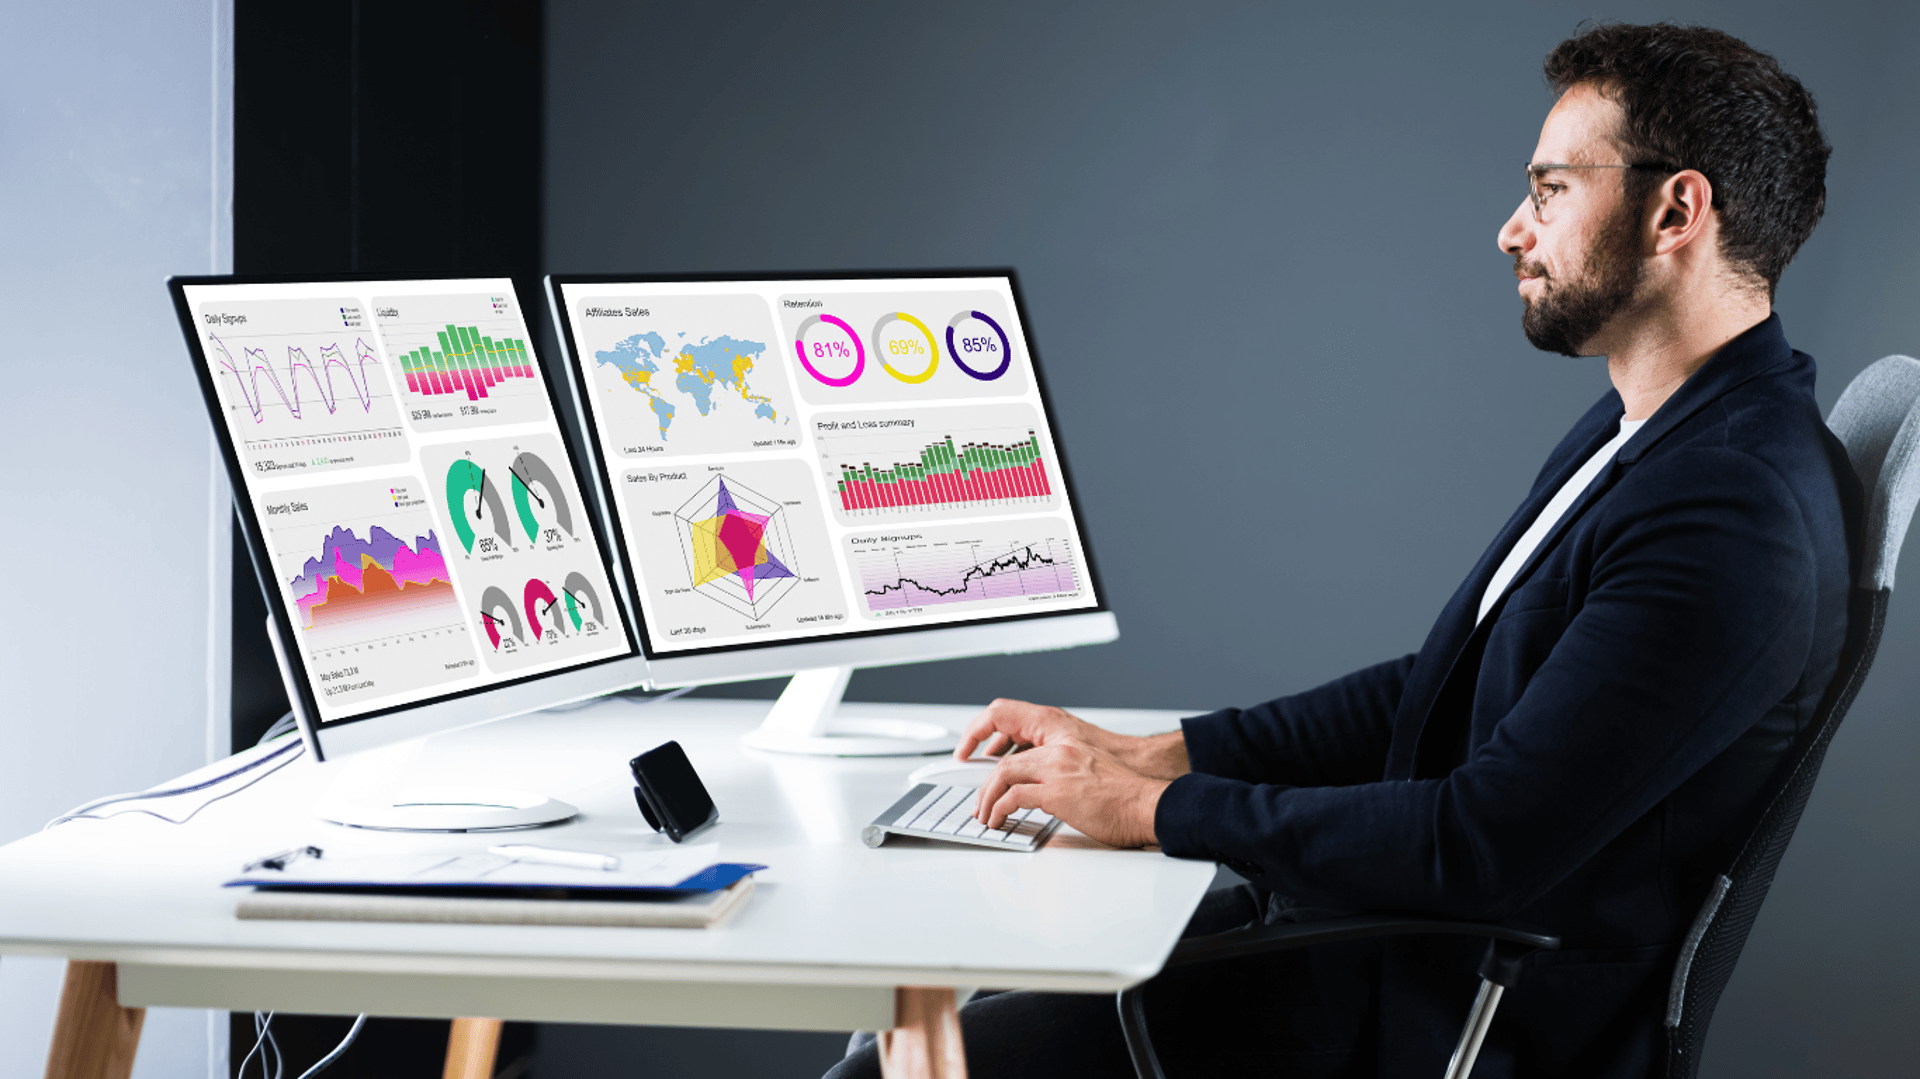
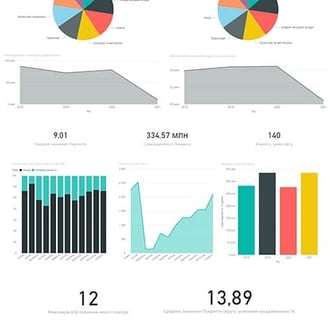
An information panel is a modern format for collecting and visually presenting large data sets (in the form of graphs, charts, maps, etc.). This is an analytical panel with a clear look for interactive interaction with a huge number of constantly changing indicators.
The information panel for the deputy of the city council will provide you with smart reports in real time, thanks to which you will see what is happening right now in the district, on a specific street, in the structures that serve it, etc. This allows you to avoid unnecessary delays and make a decision ten times faster.
Advantages
Get visual tools to organize and interact with data using maps, graphs, charts, gauges, and other visual analytics that are dynamic
Effectively manage the district in real time
Form a unified information space of the district, which contains information about the territory, regulations on its use, real estate objects, etc.
Allows you to analyze large volumes of data in a convenient format
The information panel is available on any device: TV, PC, tablet, smartphone
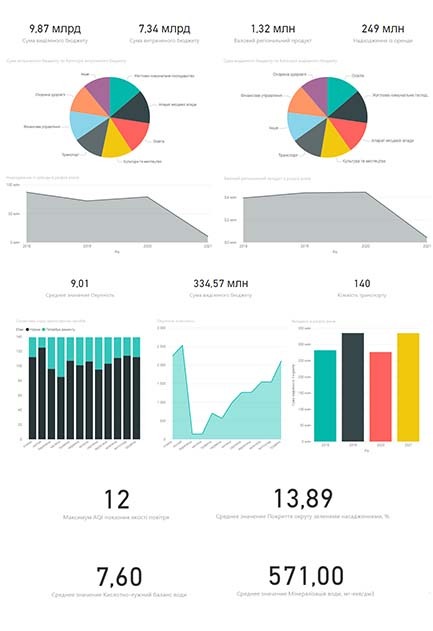
Dashboard indicators
Economy
the total amount of the budget of the selected district and its categories
the amount of spent budget for each structure / project / area, both in real time and in retrospect for previous periods

Appeal of citizens
look on the map of the streets or specific places where there are the most requests from citizens about potholes on the roads, the need to repair the playground, sidewalks, benches, lanterns, etc.
appeals from citizens about environmental problems (removal or illegal dumping of garbage, emissions from enterprises located in the district, etc.)
appeals from citizens regarding the work of communal services
Environment and ecology
quality of air, water, etc. in the district
nature of pollution and volumes of emissions from various types of industrial enterprises in the district
appeals from citizens about problems with garbage removal or street pollution
the percentage of coverage of the district by green spaces

A dashboard is a tool that simplifies obtaining and analyzing key information about your activities. With its help, you can quickly understand trends, identify problems, and make informed decisions for successful management.