
Information panel for Agronomist
COMPREHENSIVE INFORMATION ABOUT GROWN CULTURES ON THE SCREEN OF YOUR PHONE, TABLET OR COMPUTER
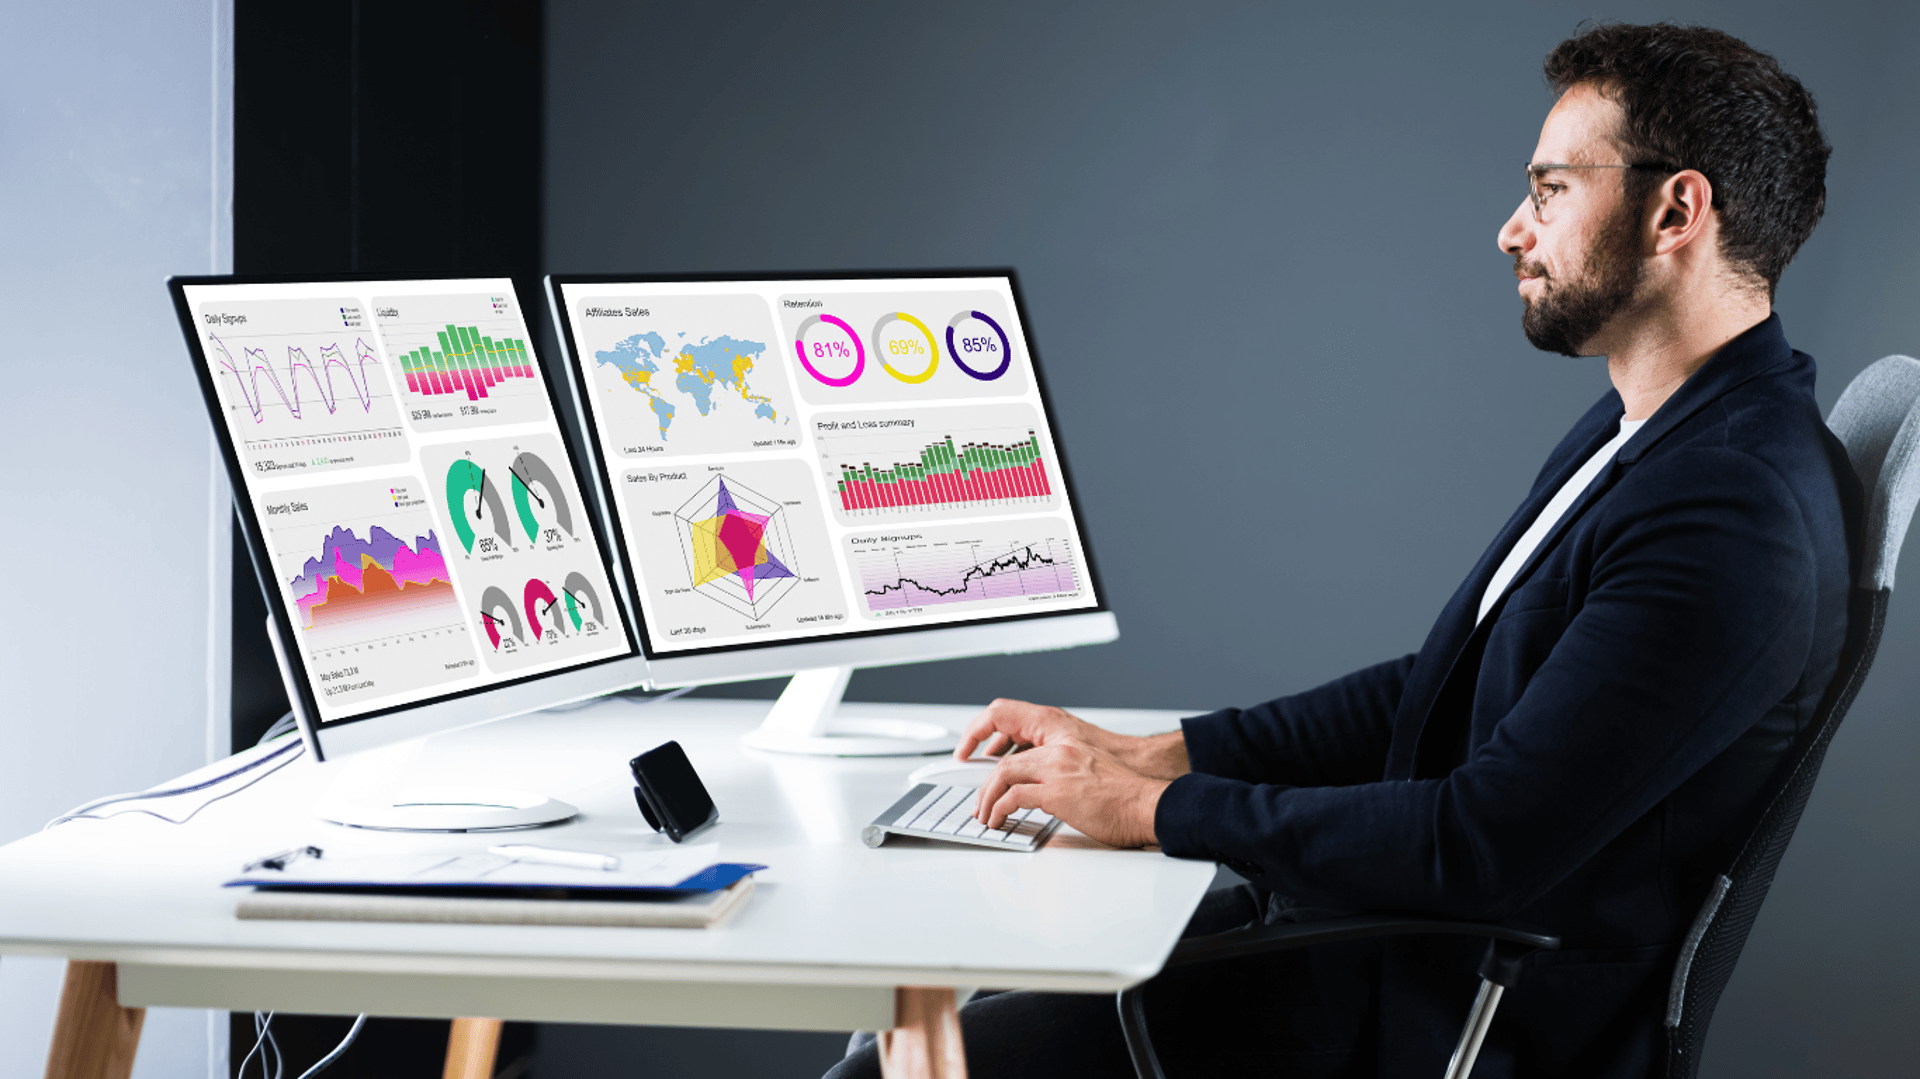
Dashboard is a modern format for the collection and visual presentation of large data sets (in the form of graphs, charts, maps, etc.). Thanks to the Dashboard, you can receive reports on the real state of affairs in the field in real time.
The dashboard for an agronomist provides comprehensive information on the condition and characteristics of agricultural land, the composition, condition and development of agricultural crops, and also allows you to forecast yields, influence various types of operations (application of seed material, fertilizers, etc.).
Key features of the dashboard
Displaying information from various types of sensor data and sensors used in the field of precision agriculture
Full automation of farm management in real time: monitoring the quality of work of agricultural machinery and workers, meteorological indicators, etc.
Tracking the ripening state of agricultural crops and forecasting their productivity
Automatic detection of problem areas of crops (waterlogging, low evaporation coefficient, low percentage of crop germination, state of crop ripening)
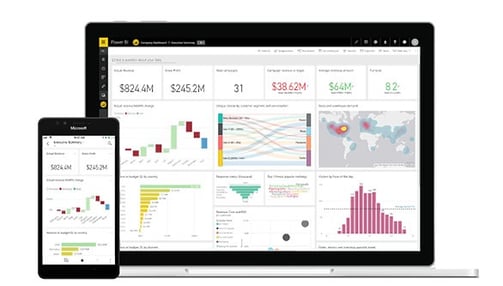
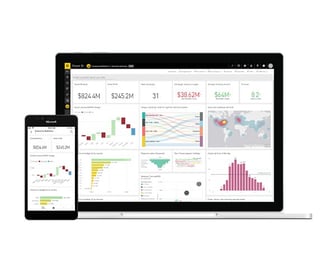
The information panel is available on any device: TV, PC, tablet, smartphone

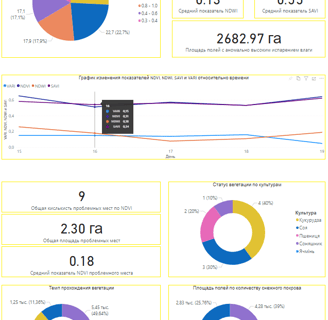
Показники дашборду
amount of land, average height difference
indicators NDVI, NDWI, SAVI, VARI
the number of fields with anomalies and the anomaly indicator
the number of fields with abnormally high moisture evaporation
the level of vegetation by crops, anomalies with the recovery of winter vegetation
% of area with lagging vegetation (vegetation anomalies)
% of the area with delayed sprouting (vegetation anomalies)
percentage of fields under snow
recommendations for water in the nearest sources (for spraying with display of alkalinity level, pH)
graph of temperature history for the last 50 years, the highest and lowest recorded temperature for the previous period
forecasting likely warming based on temperature history
daily and annual precipitation in mm
messages about worsening weather (rain, frost, number of hot days)
average soil temperature in the region


A dashboard is a tool that simplifies obtaining and analyzing key information about your activities. With its help, you can quickly understand trends, identify problems, and make informed decisions for successful management.