
Information panel for the Head of the Regional Council
ALL INFORMATION ABOUT YOUR AREA RIGHT ON THE SCREEN OF YOUR PHONE OR COMPUTER
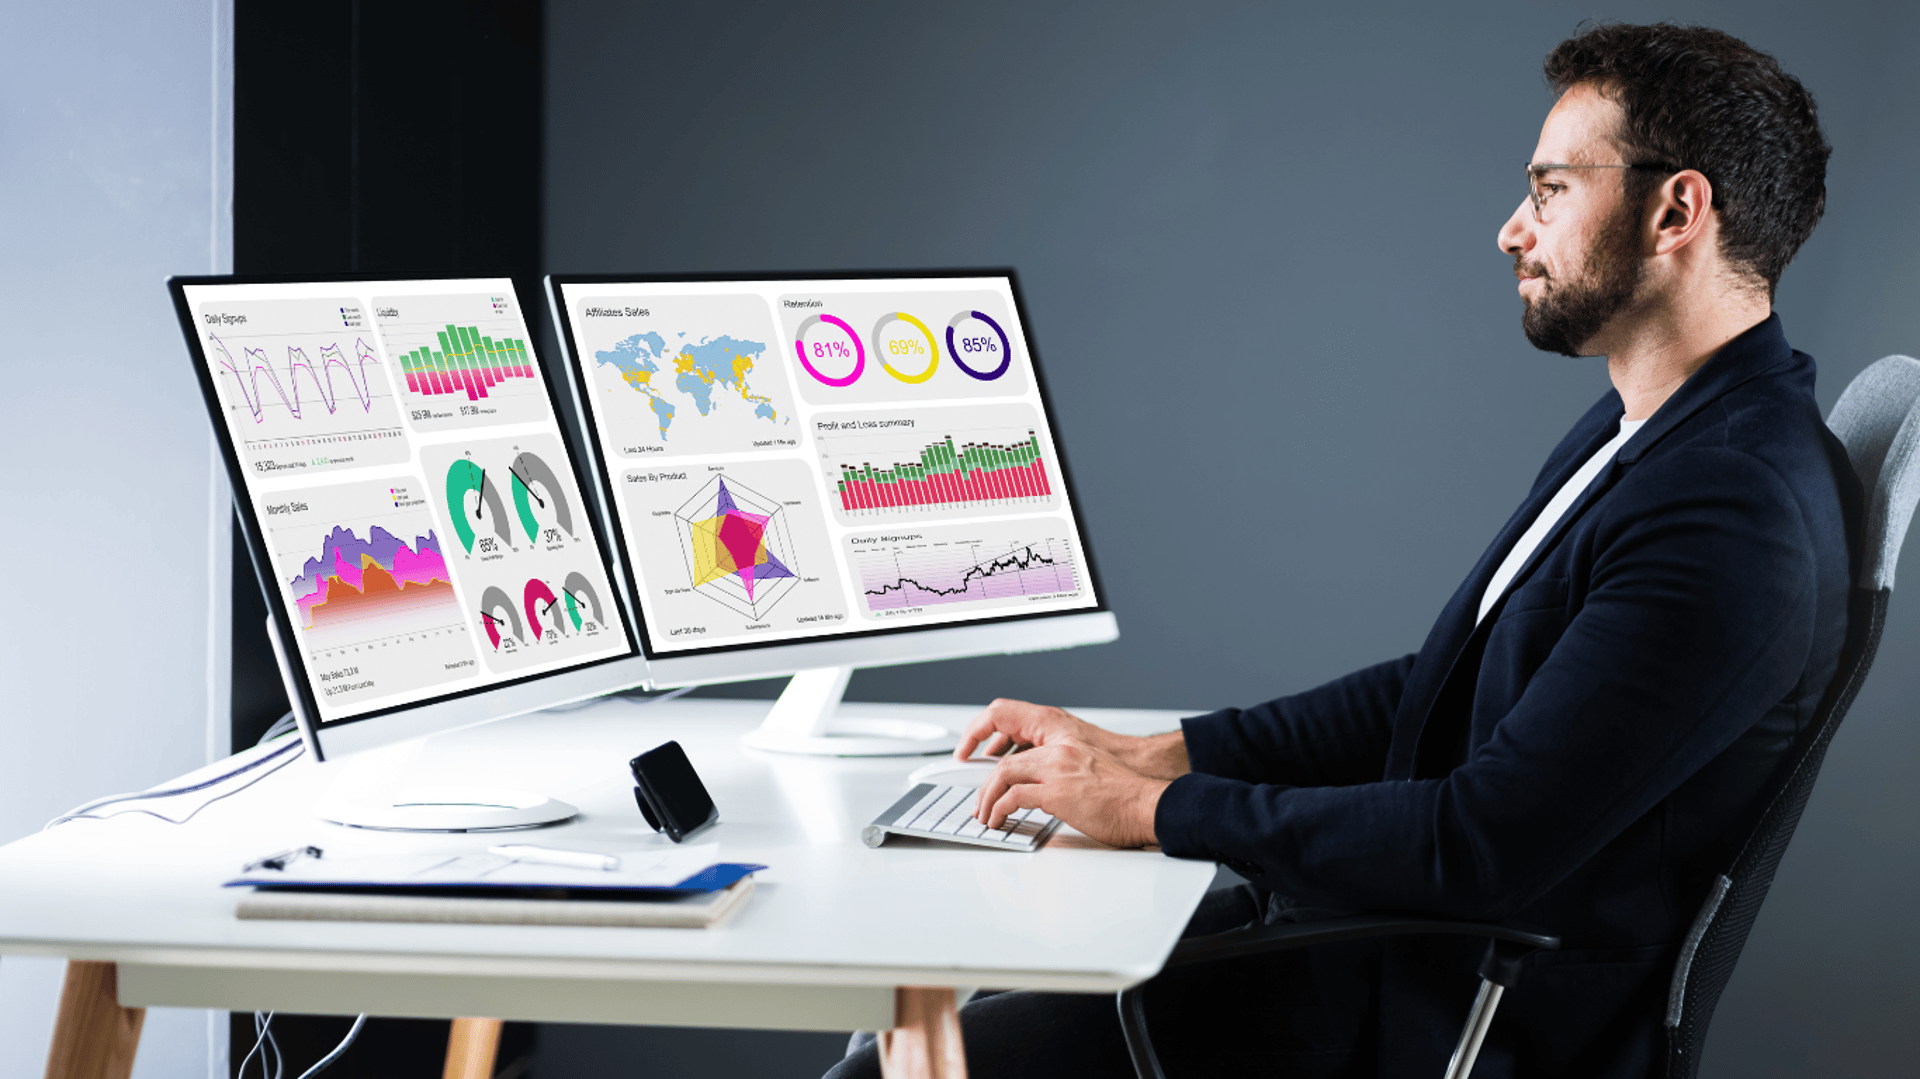
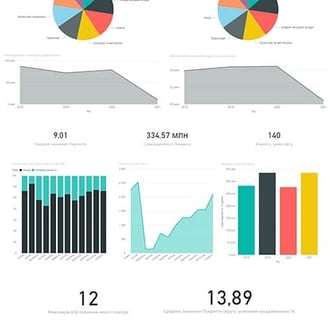
An information panel is a modern format for collecting and visually presenting large data sets (in the form of graphs, charts, maps, etc.). This is an analytical panel with a clear look for interactive interaction with a huge number of constantly changing indicators.
The information panel for the Head of the Regional Council will provide you with smart reports in real time, thanks to which you will see what is happening right now, both in the entire region and in individual united territorial communities, cities, villages and towns. This allows you to avoid unnecessary delays and make a decision ten times faster.
Advantages
Get visual tools to organize and interact with data using maps, graphs, charts, gauges, and other visual analytics that are dynamic
Analyze and monitor the structure of land use, its dynamics, threats and risks
Quickly evaluate the quality of soils, their potential yield, agroecological condition, degradation processes, long-term changes in these parameters
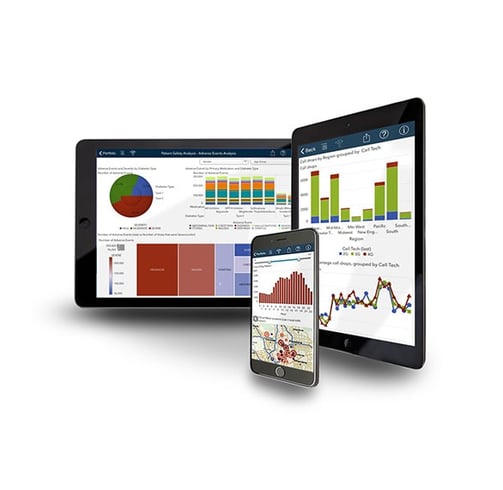
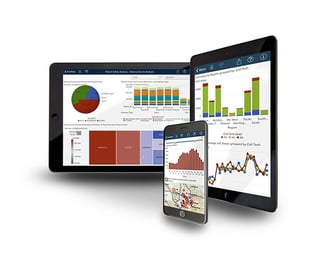
The information panel is available on any device: TV, PC, tablet, smartphone
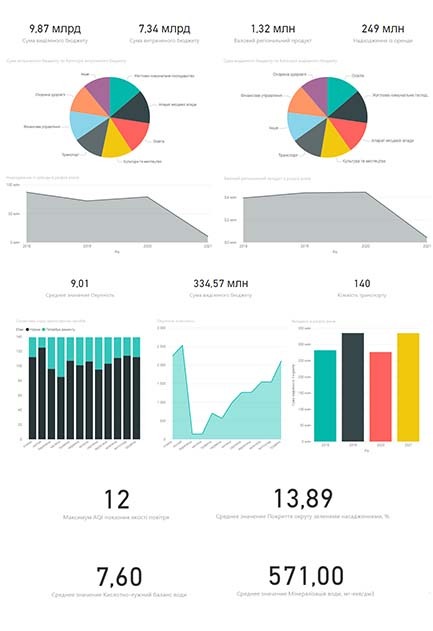
Dashboard indicators
Transport and infrastructure
the number of transport units on the balance sheet of the region, each OTG separately and how many of them need repair
the number of appeals and requests for budgeting from schools, kindergartens, social, cultural and sports institutions, medical institutions, etc.
the amount of funds from the budget that was spent on transport
number, condition of infrastructure facilities and costs for their maintenance
engineering communications: power lines, gas pipelines, water pipelines, sewage and heating networks, underground cables and inspection wells for their maintenance with an indication of their type, technical characteristics (material and diameter of pipes, depth of inspection wells, etc.)

Appeal of citizens
see on the map the districts with the most requests from citizens about potholes on the roads, the need to repair stops, sidewalks, benches, lights, etc.
rating of the reasons for appeals by citizens in matters of local transport
appeals from citizens about environmental problems (removal or illegal dumping of garbage, emissions from enterprises that pollute land or water, illegal logging, etc.)
Environment and ecology
data on water quality, drying up of rivers, deforestation, etc. in the territory of the region
nature of pollution and volumes of emissions from various types of enterprises
data on places of illegal dumping of garbage and pollution of recreation areas

A dashboard is a tool that simplifies obtaining and analyzing key information about your activities. With its help, you can quickly understand trends, identify problems, and make informed decisions for successful management.