

Organization's information center
ALL INFORMATION ABOUT YOUR AREA RIGHT ON THE SCREEN OF YOUR PHONE OR COMPUTER
The information center of the organization is a modern method of visual representation of the desired indicators (in the form of graphs, diagrams, etc.). This is a simple one-page report with a clear view for the head of the organization.
Weekly reports on the statistics of each team member, drawing graphs of statistics, assessing the state of affairs, all this is an administrative activity. Part of it refers to the functions of managers, but most of this work is performed by each team member. No matter what role a person plays on the team, he has a personal interest in accurately measuring his own results, as well as in ensuring that everyone else does.
Key capabilities of the organization's information center
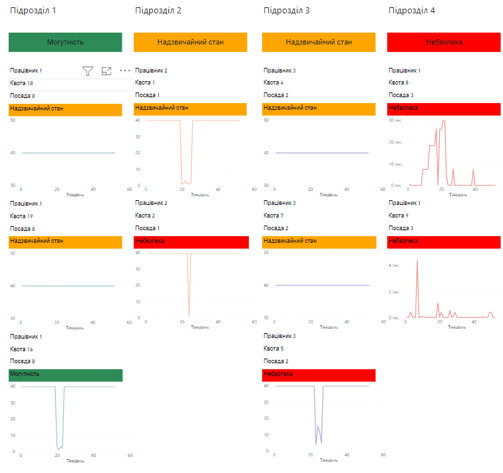
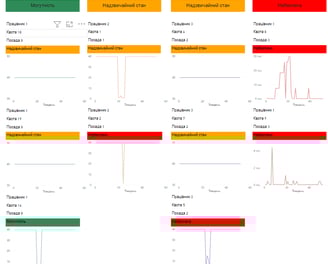
Summarized information on the main statistics of each department.
Measurement of the by-products that lead to the production of CCP.
Summary information about the current quotas of each employee of the organization in one place.
Visual color coding by subdivisions.
The state of the worker's hat.
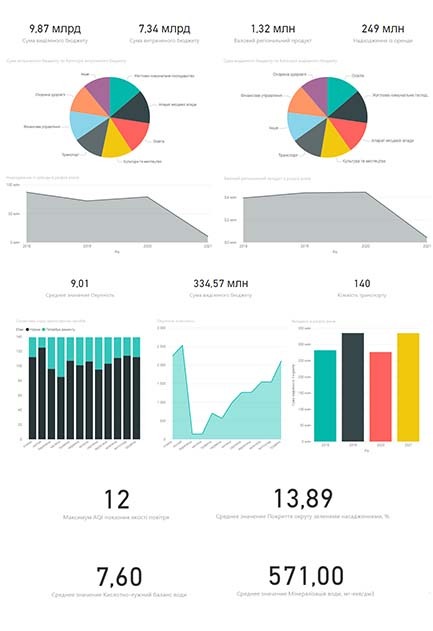
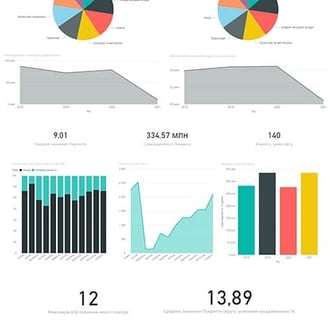
Dashboard indicators
gross revenue of the company;
the number of employees with growing statistics;
% implementation of the plan by employees;
the amount of funds on the company's account;
payables;
the number of product failures;

statistics on the number of affiliate sales;
quantity of produced product;
the amount of affiliate sales;
employee performance indicators;
the number of courses completed by employees;
number of educational materials created;
the number of employee tasks returned for revision;
number of new leads;
number of created marketing documents;
amount of sales;
etc.

A dashboard is a tool that simplifies obtaining and analyzing key information about your activities. With its help, you can quickly understand trends, identify problems, and make informed decisions for successful management.